Visualizing Relationships in Harry Potter Using Language Processing
Introduction
One of the capabilities that makes Natural Language Processing (NLP) thrilling to me is the potential to automatically summarize a corpus of text. When a human summarizes a document, the cognitive process that differentiates important information from the noise seems rather complex. Establishing the importance of a character or an event can feel subjective. Was the fact that Ronald Weasley had a pet rat that important in either of the first two books in the Harry Potter series? Are the ins and outs of Quidditch really that important to the plots of the Harry Potter books?
At the moment, these are some pretty complex questions to be asking of NLP algorithms, but perhaps we can take a closer look at how simpler approaches yield neat visual summaries of books like those in the Harry Potter series. We will end up with visualizations of character relationships like what is shown below:
You might also recognize the above as a character map. In the plot above, the stronger connections are represented by thicker, brighter colored lines. Below, we will develop the rudiments of a methodology to generate simple graphs (networks) that plot the relationships between different characters. For this post, the focus will be on the best-selling series of books in the world, Harry Potter, but this same approach can be used for mapping characters in any novel or document.
Methodology
Input
To generate these character maps, the input that we will need is quite simple. The first item is an ebook that we would like to summarize and the second is a list of the characters for whom we would like to generate a character map. The current iteration of the project only uses mobi formatted ebooks. If you have other ebook formats that you would like to analyze, you can convert your ebooks pretty easily using ebook conversion software.
Algorithm
To generate the character maps, we will be trying to tabulate the probabilities that two characters appear within a sequence of text. In this case, the sequence is defined as a window of words in a passage. For example, we can look at every sequence of 20 words in a row and identify which characters appear in similar passages. Below is an example of how this plays out. The blue text signifies the window that is being analyzed and the red text represents the occurrence of a particular character.
Dudley’s birthday - how could he have forgotten? Harry got slowly out of bed and started looking for socks. He found a pair under his bed and, after pulling a spider off one of them, put them on. Harry was used to spiders, because the cupboard under the stairs was full of them, and that was where he slept.
In the highlighted passage, both Harry and Dudley appear in the same window which would increment the tally for how many times Harry and Dudley appear together. The next window would move to the right by one word and again look for which characters appear together.
Dudley’s birthday - how could he have forgotten? Harry got slowly out of bed and started looking for socks. He found a pair under his bed and, after pulling a spider off one of them, put them on. Harry was used to spiders, because the cupboard under the stairs was full of them, and that was where he slept.
As you can see above, the blue window moved one space to the right and now Harry is the only character in the book. In this case, there is no interaction of two characters which means that no character to character tally is being incremented. We can move this window over the entire text and generate counts to determine the probability of two characters, character $A$ and $B$, appearing together:
$$ P(A \cap B)=\frac{\text{number of windows in which A and B are together}}{\text{total number of windows}}$$
To look at all passages in the book, we can iterate over all possible windows in the book moving left to right one word at a time. When we generate probabilities for all of the pairs of characters, we can accumulate this information in an $n$ by $n$ symmetric adjacency matrix where $n$ is the number of characters that we are analyzing. The matrix can be visualized below where brighter colors represent higher numeric values.
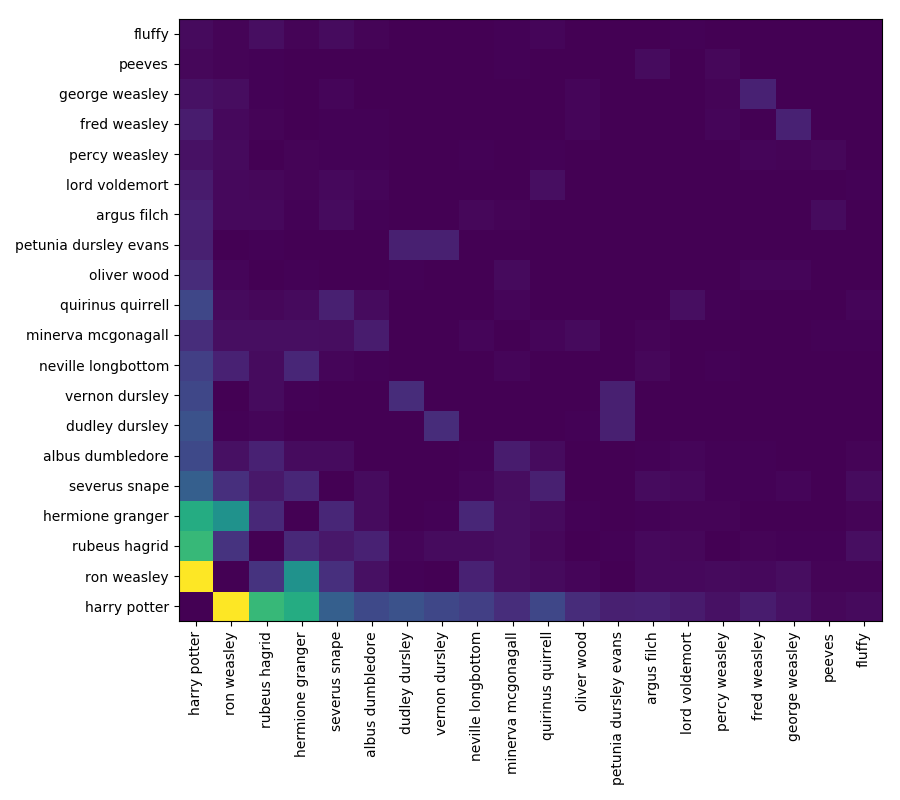
The probabilities of intersection define the strength of connections in the graph. Stronger connections assume stronger relationships because the characters interact more by appearing in similar passages in the book. That’s all there is to it.
Visualization
To generate these character maps, I’m using NetworkX which is an easy-to-use tool for visualizing graphs. It can convert python data structures into graph format very easily.
Results and Analysis
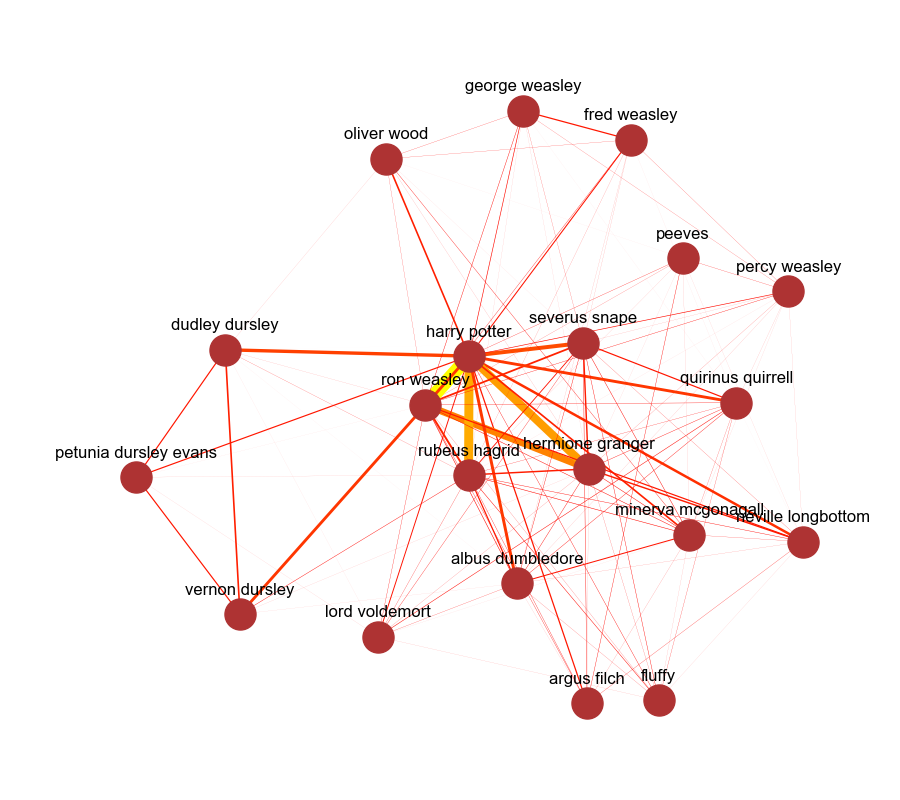
What exactly do character maps reveal? Let’s take a look at the character maps for the first book, Harry Potter and the Philosopher’s Stone and the seventh book, Harry Potter and the Deathly Hallows.
The first book’s top 20 characters look like this:
And the seventh book top 20 characters looks like this:
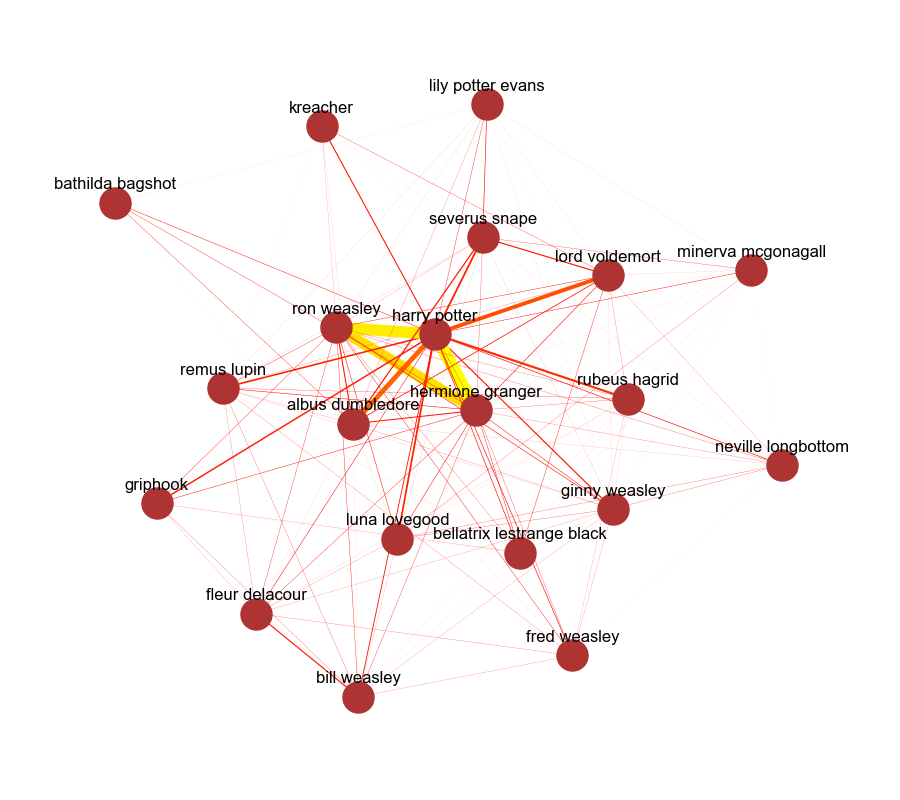
In both books, it is apparent that Harry is the central character and that both Ron and Hermione are close to Harry Potter. In the first book, Harry’s relationship with Ron is much stronger than his relationship with Hermione. However, by the seventh book, it looks as though Harry, Ron and Hermione all have high probabilities of intersection. You can also see that Hagrid has a much stronger connection to Harry in the first book compared to the seventh book.
All of the Harry Potter books have character maps located here.
Final Thoughts
While there are more advanced methods that can summarize text by extracting concepts such as TextRank, I like this method because it is very easy to implement. Furthermore, I can tune the graphs that I am generating by manually intervening in the process to define which entities I would like to draw relationships for. In the future, I would like to take a second look at this problem and redraw the connections based on sentiment (positive vs. negative relationshis) and look deeper into the use of named-entity recognition to automate the generation of significant characters. Stay tuned for more!