Faster Flu Updates Using CDC Reporting and Regression Modeling
Introduction
Thanks to having newborn with a developing immune system at home, I have been stricken by a mild case of hypochondria. This hypochondria is exacerbated by the fact the current flu season is especially ominous and has been particularly harsh on young children.
To keep track of where we are in the flu season, the CDC publishes a weekly report every Friday. Thanks to my current state of mind, I am checking this weekly but am frustrated with the frequency with which the reports get updated. Thanks to horse race journalism in political elections, I have come to expect this type of reporting on all facets of my life. In the same way that I want to know how well Donald Trump is polling on a daily basis, I want to know the status of the flu. Unfortunately, the CDC flu report lags behind by a week which means that if I want to know the status of the flu on Friday, I have to wait until next Friday to really know what is going on. Should I be optimistic about the trend in flu activity or should I keep drowning my hands in hand sanitizer, forcing colleagues to not shake hands but elbow tap instead, and hide at home whenever I can?
To help put satiate my need for continuous updates on the state of the flu outbreak, a model may or may not help. In this post, I am going to attempt to build a regression model that looks at data from the past and forecasts the current state of the flu.
Methods
The CDC has an interactive application from which one can download historical flu data. The dataset goes back to 1997 which means that there is over 20 year’s worth of data to build a model off of. The fields of interest in the dataset are:
YEARWEEKTOTAL SPECIMENSA (H3)A (2009 H1N1)A (Subtyping not Performed)BPERCENT POSITIVE
Note that the way that the CDC reports flu data changed in 2015 so some joining of the dataset is necessary. In 2015, the CDC started separately reporting results coming from clinical and public health labs. To combine the new and old data, fields from the older set were joined with aggregated data from the newer two sets.
For a given time $t_{i}$, there will be a corresponding vector $\mathbf{x_{i}}$ of data. My goal is to try and predict next week’s PERCENT POSITIVE cases of flu, $y_{i}$, using this week’s and prior week’s data $\mathbf{x_{i}}$. To set up the data for this problem a couple of transformations occur. First, lookback information is added for each row. That is, for week $t_{i}$, data for weeks $t_{i-1}$, $t_{i-2}$ through $t_{i-k}$ where $k$ represents how far back the model will look to make predictions. Furthermore, the week to week differences are also included. For data element $x_{i,j}$, the week to week difference for weeks $i$ and $i-1$ or $d_{i-1,j}$ is defined as
$$ d_{i-1,j} = x_{i,j}-x_{i-1,j} $$
After these transformations take place, we can try and predict $y_{i}$ using the current week’s data (delayed by one week), prior week’s data and the week to week differences. To expand on the number of features for prediction, the products of different features were taken. Because there are only around 1000 data points, the top 15 features were selected using f-regression and the remaining features were discarded to avoid overfitting.
This information can be fed into a regression model which predicts the numeric value of the current state of the flu. Assuming the model is good enough, we can rest easy with an educated guess at what the current week’s flu data is and get a sense of whether the activity is increasing or decreasing from previous weeks.
Results
Several different regression models were tested. These include
- Generalized Linear Regression
- Support Vector Regression
- Regression Trees
- Gradient Boosted Regression Trees
Of these algorithms, it did not appear that the more complex algorithms added much predictive power. All models yielded coefficients of determination ($R^{2}$ values) of around 0.97 to 0.98. Because all of the models were roughly equivalent in terms of accuracy, the linear regression model will be dissected because it is (a) simpler and (b) easier to interpret.
First of all, a parity plot of the test dataset reveals that the model predicts the level of flu activity with a reasonable degree of accuracy.
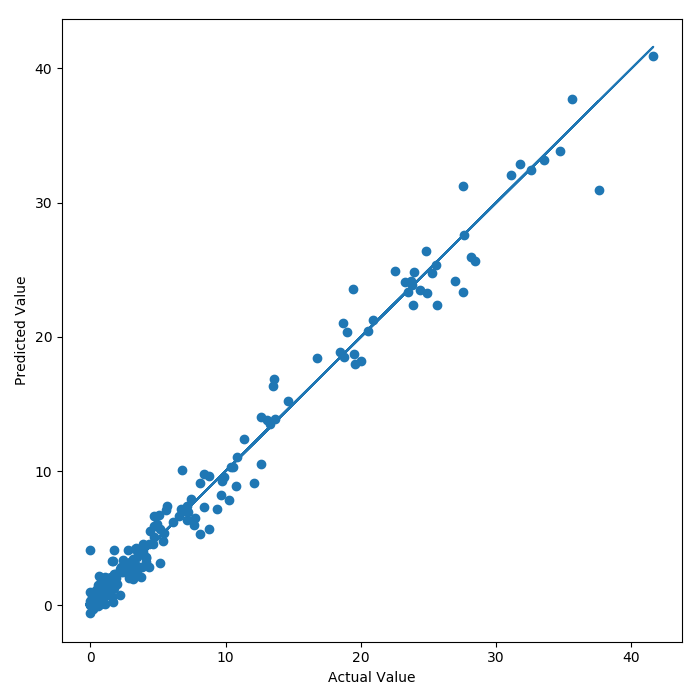
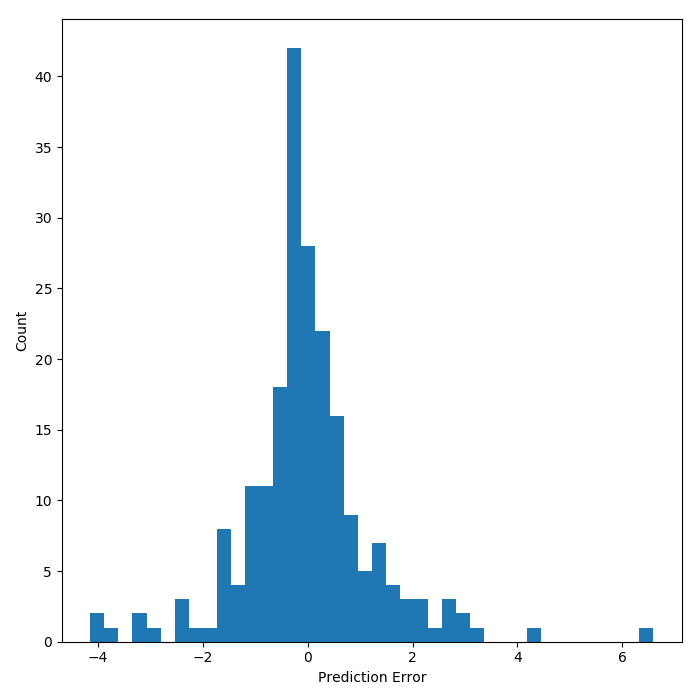
For this particular linear model the $R^{2}$ value is 0.97. To focus in on the error of prediction, the histogram below shows that the model is mostly correct but that the error can be $\pm$ 6 ($\sigma=\pm1.5\%$) percent off in the test set. The scatter plot reveals that there is some heteroskedasticity in the predictions. As the value of the predictand increases, so does the error of prediction.
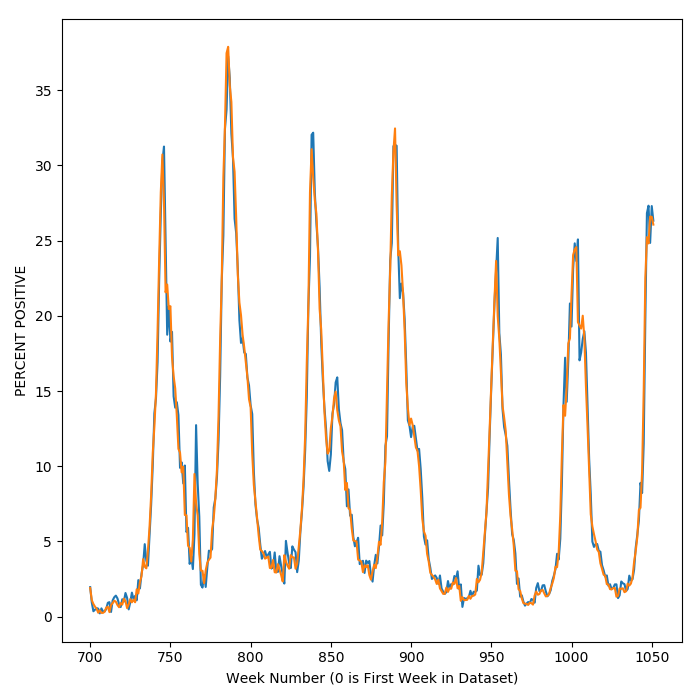
To see how the model tracks with the results, a plot of flu activity over time reveals that the model (in blue) tracks data for actual flu activity (in orange) pretty closely. When flu season kicks into high gear and activity swings upward, so does the model prediction.
So far, the results presented paint a fairly rosy picture of the model. If one zooms in, however, upon the predictions of activity over time, it becomes apparent that the model is not always accurate at predicting whether flu activity will go up or down in the short term. The plot below shows a close up view of the week by week predictions.
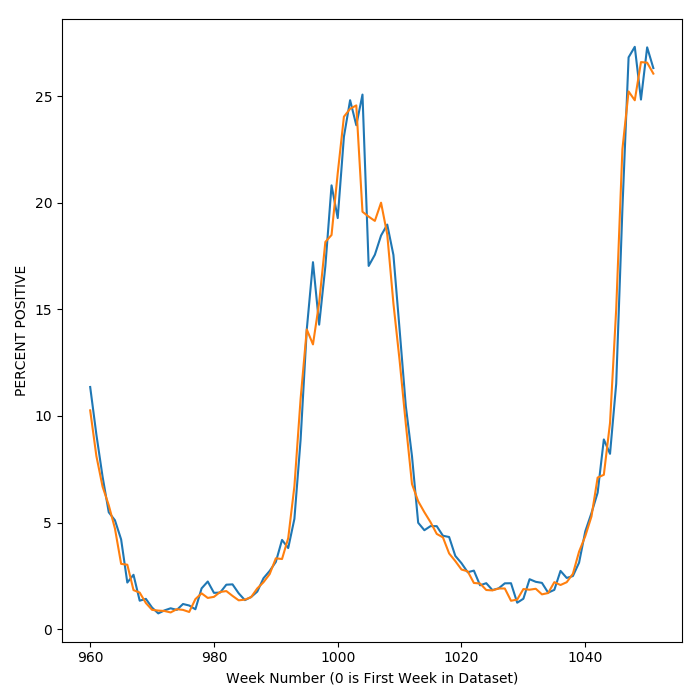
Sometimes the model predicts that the following week will go down, while activity spikes upward quite sharply.
Towards ascertaining whether this model can be used for its intended purpose, that is horse race flu journalism, it would be good to know if the model is at least predicting the upward or downward trend of flu activity. When the model predicts that flu activity is increasing, it would be good to know that it is actually increasing. Upon analyzing the data, it appears that the model predicts the upward or downward trend in flu activity with an accuracy of around 67%. In other words, the model is correct about this trend 2 out of 3 times. This means that the model is definitely better than flipping a coin (50% accuracy) but it is by no means close to an absolute certainty.
This Week’s Flu Prediction (Starting 02/04/2018)
Finally, this model can be used to predict the current state of the flu given last week’s report. Last week, the value of PERCENT POSITIVE came in at 26.5 percent. The model predicts that current flu activity is slightly lower at 25.5 percent. This prediction of a downward trend has a 2⁄3 chance of being correct.
In conclusion, it looks like flu activity will continue to be relatively high so I’m going to continue to be paranoid. However, given the fact that the change in activity is downward, I can be optimistic about the weeks to come.
A Final Disclaimer
Prediction of the state of the flu is something that has tripped up capable modelers before. Consider Google’s former program to predict flu activity using search activity. While a promising approach, the model features were not properly vetted and fixated upon search terms that correlated with flu season like “high school basketball.” It seems like this model focuses on more relevant data, but I’m not a subject matter expert on flu modeling so it’s hard to say if this model is making some kind of blatant error.
Thanks for reading! Check out the GitHub project here.